A WooCommerce sales report plugin turns a long list of orders into a few numbers you can act on. This woocommerce sales report plugin guide is for owners of small online shops in Bangladesh who run their store on WooCommerce or Themeve Commerce and want to know, without spreadsheets, whether this week was better than last week and why.
We will look at the handful of numbers worth checking, how to read them, the mistakes that make reports lie, and how Order Analytics shows those numbers on one screen.
Why a small shop needs a sales report
When a shop is small, the owner remembers everything. After a few hundred orders, memory stops working. You feel that sales are good because the phone rings a lot, but you do not know how many of those orders were cancelled, how many came back from the courier, or which products actually paid for your Facebook ads.
A report replaces feelings with facts. It tells you how much you sold, how many orders you handled, and what the average order was worth. With that, decisions about stock, ads and staff become much easier. You stop ordering more of a product that only looks popular and start ordering more of the one that truly sells.
The numbers that matter
Start with sales value: the money from orders that were actually completed or are on their way. Next comes the number of orders. Divide one by the other and you get average order value, which tells you whether buyers are adding a second item or only buying the cheapest one. If average order value rises, your bundles and offers are working.
Then look at order health. How many orders are completed, how many are still in progress, and how many were cancelled or returned? A rising share of cancelled and returned orders is an early warning that something is wrong with product photos, delivery charges or the buyers your ads attract.
Products and payment methods
Two more views complete the picture. Top products show which items bring in the most money in a period. The payment method summary shows how buyers pay. If most sales are cash on delivery, you know how much money is sitting with couriers at any time, and you can plan advance-payment rules for larger orders.
What an order analytics dashboard should show
A good order analytics dashboard puts all of this on one page with a date control at the top. You should be able to switch between today, yesterday, the last 7 days, the last 30 days and this month, or pick your own range for a campaign. Every number on the page should follow the range you choose.
It should also show a simple trend chart, a status breakdown and a list of recent orders that you can click. The point is not pretty graphs. The point is to see a problem early, such as a pile of orders stuck in processing, and fix it before buyers complain.
How the WooCommerce sales report plugin works
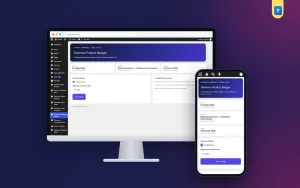
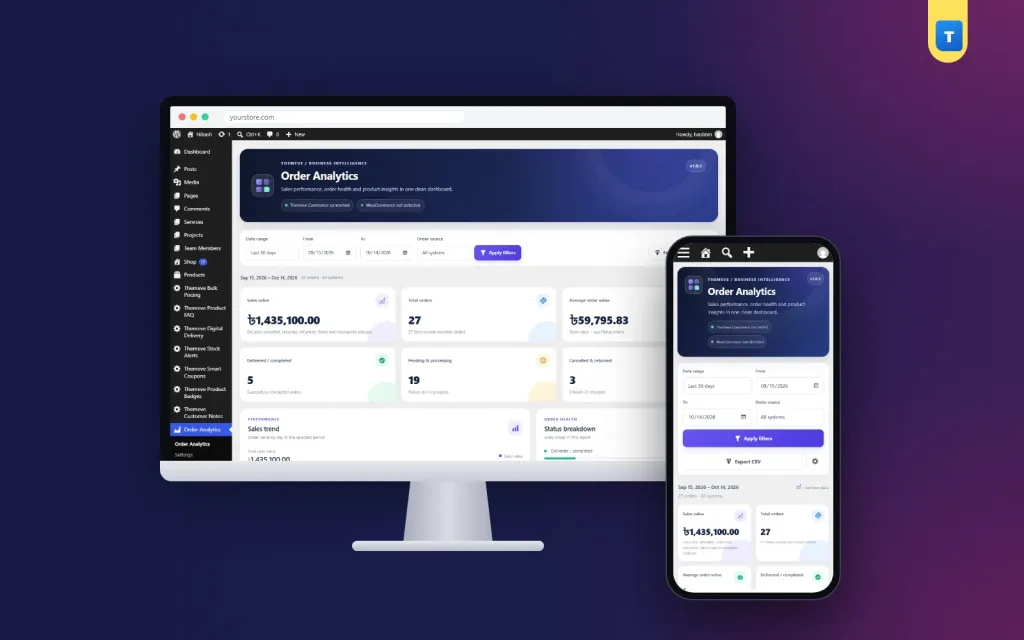
Order Analytics adds a screen called Order Analytics to the left admin menu. At the top are cards for sales value, total orders, average order value, completed orders, in-progress orders and cancelled or returned orders. Below them are a sales trend chart, an order status breakdown, the top products list and a payment method summary. A recent orders table at the bottom links each order to its order screen.
The date presets cover today, yesterday, last 7 days, last 30 days and this month, and you can set a custom range. A source filter lets you see all orders, only WooCommerce orders or only Themeve Commerce orders, which is handy when you move from one system to the other. Any range can be exported as a CSV file for your accountant.
Honest totals
The plugin leaves unfinished checkout drafts out of every figure, so abandoned checkouts do not inflate your sales. Cancelled, refunded, failed and returned orders are left out of sales value and shown in their own count instead. When a range mixes currencies, the combined total is hidden rather than showing a wrong sum, because currencies are not converted. All figures are worked out on your own server and no order data is sent to outside services.
Setting it up
Upload the zip from Plugins, Add New, Upload Plugin, and activate it. Order Analytics needs an active Themeve licence key. Until the key is entered, the plugin stays switched off and only the lock screen and License screen open. Paste the key from My Account, Licenses, and the full report becomes available. New versions arrive in Dashboard, Updates while the licence is active.
There is nothing to import. The report reads the orders you already have, so the first time you open it, last month's numbers are already there. If you want to understand how WooCommerce stores order statuses, the WooCommerce documentation explains them clearly.
A weekly reporting routine
Reports help only when you read them on a schedule. Pick one time each week, such as Saturday evening. Open the last 7 days and write down four numbers: sales value, orders, average order value and the cancelled or returned count. Compare them with the week before. That takes five minutes and shows the direction of your business.
Once a month, look at the last 30 days. Check top products and decide what to restock. Check the payment summary and see whether cash on delivery is growing faster than advance payments. After a campaign, set a custom range for the campaign dates and compare it with the same number of days before. Now you know whether the campaign paid for itself.
Bangladesh tips for reading your numbers
Expect peaks around Eid, Pohela Boishakh and the start of winter, and do not judge a normal month against a festival month. Compare like with like. If you run a Facebook page and a website, enter phone orders into the store as well, so the report covers all your sales.
Watch the cancelled and returned count closely. In cash on delivery businesses it often grows quietly. If it rises, look at which products are being returned and which areas they go to. Courier Intelligence can record delivered and returned parcels per phone number, and Smart Order Automation can flag large orders for review or send emails when orders change.
Turning numbers into decisions
Numbers are only useful when they change what you do. Here are three simple examples. If average order value is low, create a small bundle, such as a shirt with a matching cap, and promote it on your Facebook page. Next week, check whether average order value moved. If it did, keep the bundle; if not, try a different pairing.
If one product is always in the top list, make sure it never runs out, and consider a second colour or size. If a product you spend a lot of ad money on never reaches the top list, stop the ads and test another item. A sales report gives you a fair test for every idea, because you can compare equal date ranges before and after.
If the payment summary shows that most buyers choose cash on delivery, think about your cash flow. Money from COD orders arrives only after the courier pays you, often several days later. Knowing the share of COD helps you plan stock purchases and staff salaries without surprises at the end of the month.
Common mistakes with sales reports
The first mistake is counting every order as a sale. An order that was cancelled or refused is not money. A WooCommerce sales report plugin that mixes them hides the truth, which is why Order Analytics keeps them apart. The second mistake is reading only totals. A higher total can hide a lower average order value or a rising return rate.
The third mistake is comparing different lengths of time, such as a 31-day month with a 28-day month, without noticing. Use the same number of days. The fourth is never exporting anything. Keep a monthly CSV, and after a year you will have a simple history of your shop that no screenshot can match.
Frequently asked questions
Does it work on Themeve Commerce?
Yes. Use the source filter to see Themeve Commerce orders, WooCommerce orders or both together.
Are unfinished checkouts counted?
No. Checkout drafts are left out of every figure, so your sales value shows only real orders.
Can I share the report with my accountant?
Yes. Export the selected date range as CSV and send the file.
Does the plugin send my data to an analytics company?
No. Every number is worked out on your own website.
WooCommerce Sales Report Plugin guide: final thoughts
A small shop does not need dozens of charts. It needs sales value, order count, average order value, order health, top products and payment methods, for any date range, with honest totals. Read them every week and you will make better calls on stock, ads and delivery. To see those numbers for your WooCommerce or Themeve Commerce store on one screen, try Order Analytics.